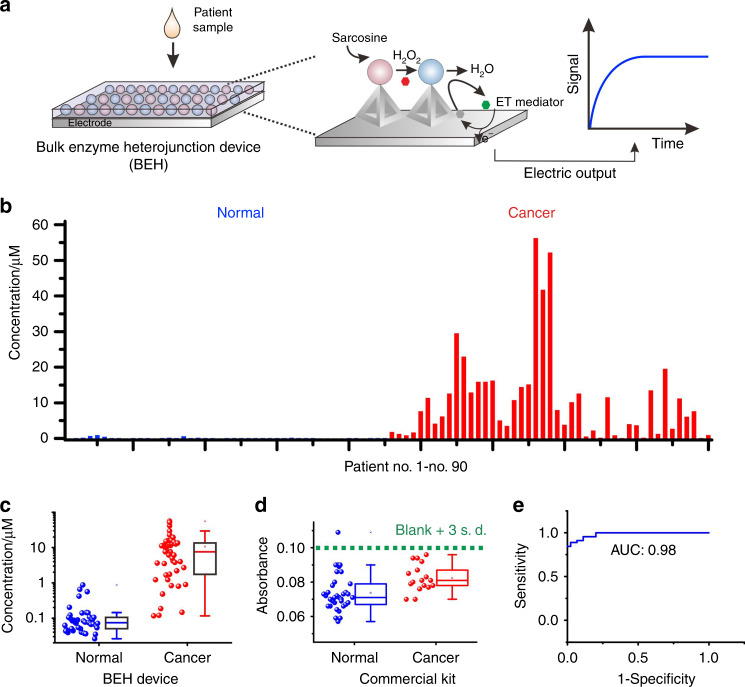
Fig. 5. Sarcosine detection in clinical samples.
a Schematics for the BEH-based sarcosine sensor. b Sarcosine detection with a multiplexed electrochemical chip in 90 clinical samples including serum from normal people (45 cases) and cancer patients (45 cases). c Statistical analysis reveals effective discrimination of cancer patients from normal people using the sarcosine sensor. d A control sarcosine assay with the commercial kit in clinical samples. Of note, most signals were in distinguishable from the background due to the poor sensitivity. e ROC analysis for the discrimination between normal and PCa using the sarcosine sensor. In the boxplots of c and d the horizontal line represent the median value, the up and down bounds of box represent the first quartile and third quartile values and the vertical lines represent the whisker. The sample size used to derive statistics is 45 for each group in c. The sample size used to derive statistics is 35 and 17 for groups in d. Source data are provided as a Source Data file.

