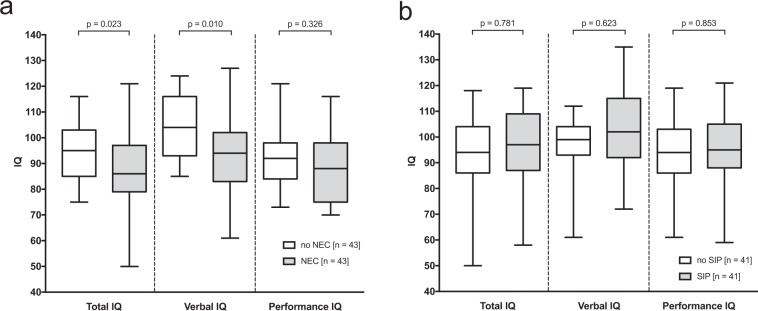
Figure 2.
(a) Total, verbal and performance intelligence quotient scores in infants with and without NEC. Boxplot of IQ scores (total, verbal, performance) for matched infants with history of NEC and without a history of NEC. p-values are derived from T-Test. (b) Total, verbal and performance intelligence quotient scores in infants with and without SIP. Boxplot of IQ scores (total, verbal, performance) for matched infants with history of SIP and without a history of SIP. p-values are derived from T-Test.

