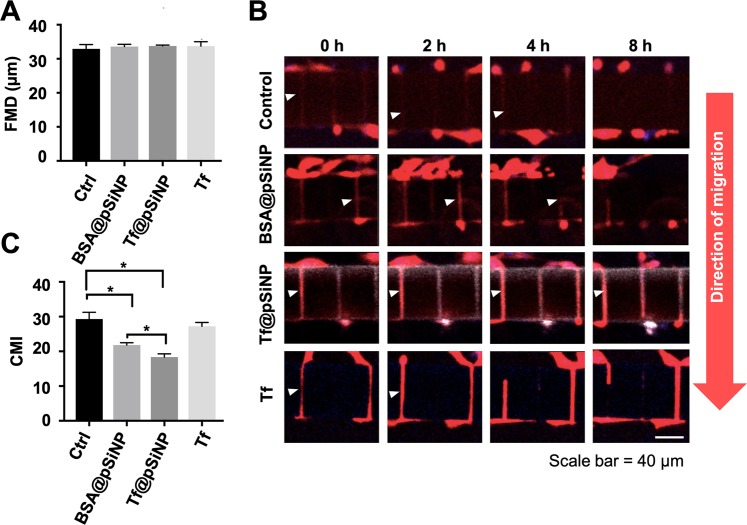
Figure 4.
The effect of Tf@pSiNP, BSA@pSiNP and Tf treatments on GBM cells migration in the migration chip. (A) U87 cell motility (restriction free) in the initial cell side reported as FMD. FMD was averaged from measurements taken from 3 chip units (n = 3). (B) Montage of U87 cell migration across the microchannels after treatments over the period of 8 h. Red is cytoplasmic mCherry. (C) Cell migration across the microchannels reported as CMI (n = 3, error bar = ±1 SD. * indicates p < 0.05).

