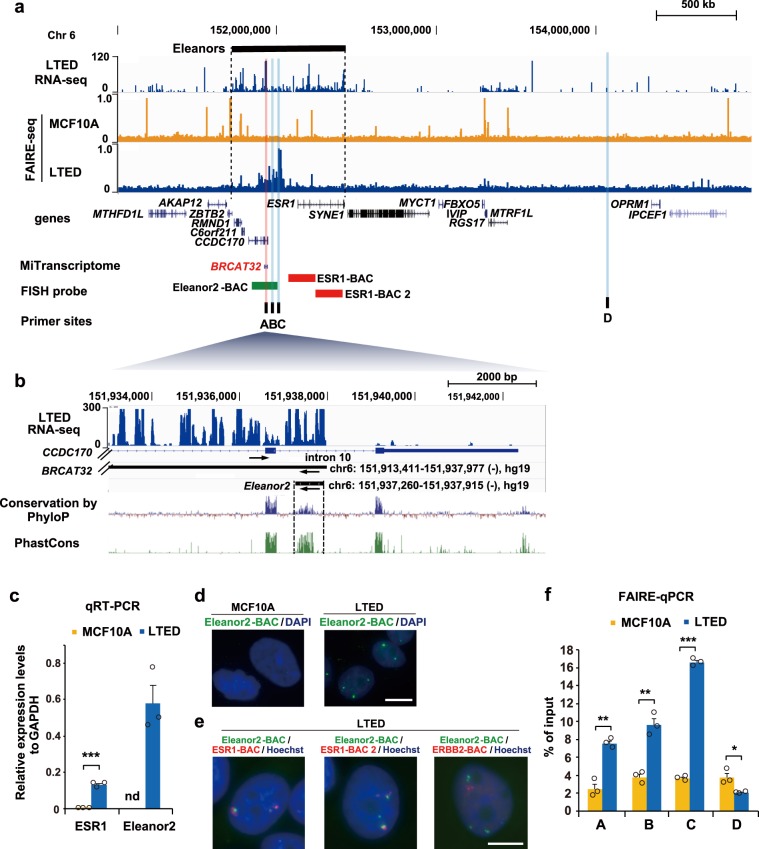
Fig. 1. Eleanor2 RNA promotes an open chromatin conformation in LTED cells.
a Overview of the Eleanor2 locus and its neighboring region (Chr6:148,180,000–156,290,000). The RNA-seq25 and FAIRE-seq24,28 tracks in the indicated cells are aligned against the genome reference GRCh37/hg19. Positions of the UCSC genes and lncRNAs annotated in MiTranscriptome30. The BAC DNA used as the FISH probe (green bar: Eleanor2-BAC, red bars: ESR1-BAC and ESR1-BAC2), and the primers used for FAIRE-qPCR (black bars; A–D) in Fig. 1 d–f are also shown. The red vertical line indicates the most highly transcribed region of the Eleanors, named Eleanor2, which corresponds to part of the breast cancer-associated lncRNA BRCAT32. The primer site A is in the Eleanor2-coding site. Sites A, B, and C were suggested to have open chromatin conformations, while site D was predicted to be closed, according to the FAIRE-seq track above. b Enlarged view of the region surrounding Eleanor2, which is highly conserved among mammals. Eleanor2 and BRCAT32 are transcribed in the opposite orientation from the CCDC170 gene (arrows). c Eleanor2 RNA is highly expressed in LTED cells. The qRT-PCR values of ESR1 mRNA and Eleanor2 RNA relative to the control GAPDH mRNA are shown. The expression of Eleanor2 RNA was not detectable in MCF10A cells (marked as nd). d RNA-FISH visualizing RNA foci containing Eleanor2. The Eleanor2-BAC DNA was used as the probe (green). DNA was counterstained with DAPI (blue). Scale bar, 10 μm. e Transcripts from the Eleanor2 region, but not the ERBB2 region, were colocalized with the ESR1 region in the RNA clouds. The BAC-DNA clones were used as the probe. Scale bar, 10 μm. The maximum intensity z-projection of each channel is shown. f FAIRE-qPCR showing that the Eleanor chromatin forms an open configuration in LTED cells. Values represent amounts of DNA in the nucleosome-free fraction relative to the input DNA. Data presented in c and f are means ± s.e.m. (n = 3, biologically independent samples). P-values were calculated using the unpaired, two-tailed, Student’s t test (*P < 0.05, **P < 0.01, ***P < 0.001).

