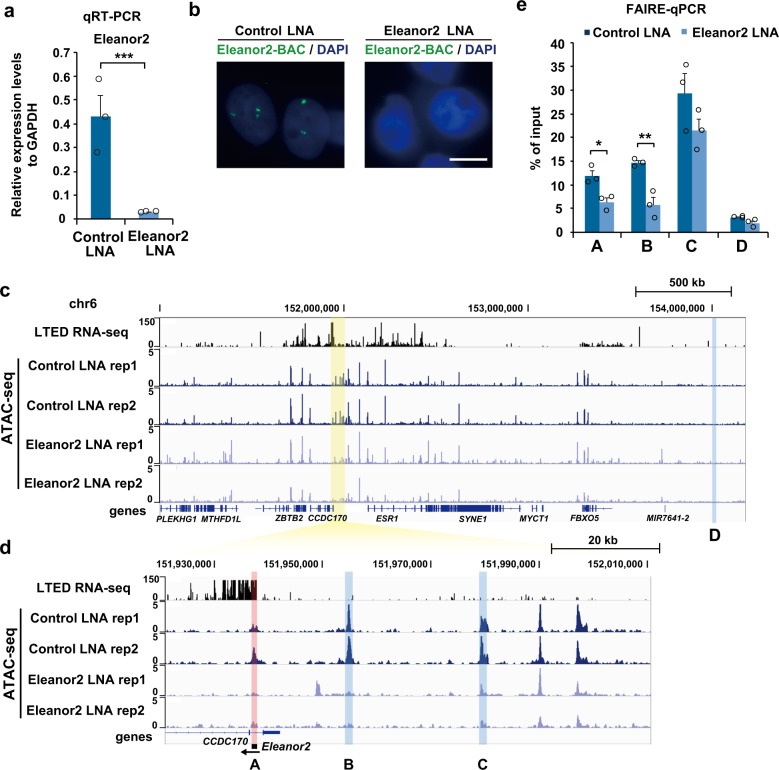
Fig. 5. Eleanor2 RNA depletion reduced open chromatin conformation.
a Depletion of Eleanor2 RNA. LTED cells were treated with the indicated LNA (locked nucleic acid), and the expression of Eleanor2 RNA was measured by qRT-PCR. The values relative to the control GAPDH mRNA are shown. b The Eleanor RNA signal was suppressed with Eleanor2 RNA depletion. The Eleanor2-BAC was used as the probe for RNA FISH (green). Scale bar, 10 μm. c ATAC-seq showing that chromatin accessibility was reduced with Eleanor2 RNA depletion in LTED cells. Overview of the region, including the Eleanor2 site (highlighted in yellow). The RNA-seq25 and ATAC-seq tracks of LTED cells with the control LNA and Eleanor2 LNA were aligned against the genome reference GRCh37/hg19. d Enlarged view of the Eleanor2 site. ATAC-seq peaks of A, B, and C were reduced by the Eleanor2 depletion. e FAIRE-qPCR revealed that nucleosome-depleted DNA was decreased with Eleanor2 RNA depletion in LTED cells. Values represent amounts of DNA in the nucleosome-free fraction relative to the input DNA. Data presented in a, e are means ± s.e.m. (n = 3 biologically independent samples). P-values were calculated using the unpaired, two-tailed, Student’s t test (*P < 0.05, **P < 0.01, ***P < 0.001).

