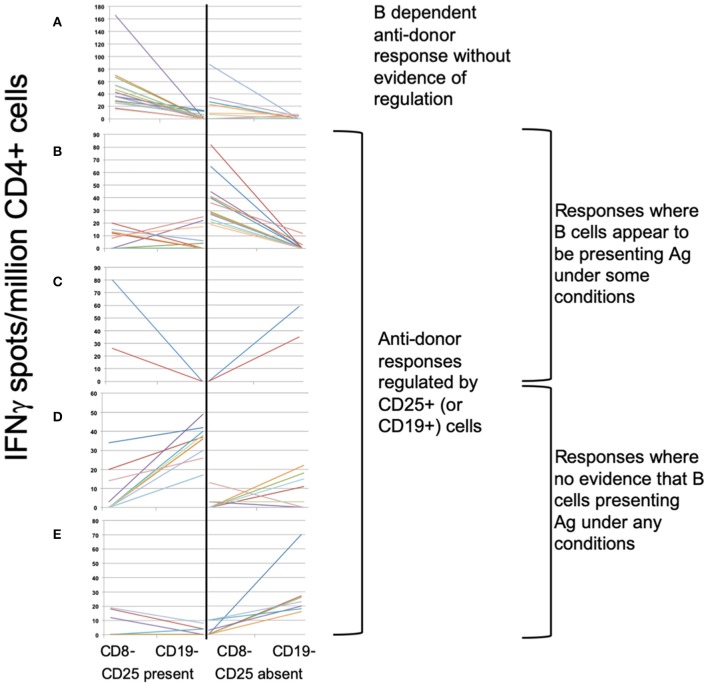
Figure 4.
ELISPOT patterns. (A–E) Illustrates the 3 basic patterns of anti-donor IFNγ production, displayed as the spot count (corrected for flow cytometric assessment of CD4+ cell proportions) present under 4 different conditions: CD8- (CD8-depleted PBMC); CD19- (CD8- & CD19-depleted PBMC), both performed in presence or absence of CD25+ cells. Samples showing anti-donor responsiveness from 51 recruits, including from those not in the exploratory analysis, are represented. (A) Pattern 1: Unregulated B cell-dependent pattern. Showing spot counts that reduce (>20%) on depletion of CD19+ cells in presence of CD25+ cells (± in absence of CD25+ cells). N = 16 samples. (B,C) Pattern 2: B cell-dependent anti-donor patterns with evidence of regulation1. (B) CD25+ regulated B-dependent responses: B cell-dependent anti-donor responses only detectable in absence of CD25+ cells. N = 14 samples. (C) CD19+ regulated B-dependent responses. B cell-dependent anti-donor responses in presence of CD25+ cells, but when CD25+ cells absent, depletion of CD19+ cells increases spot count (>20%), indicating evidence of regulation by B cells. N = 2 samples. (D,E) Pattern 3: Regulated anti-donor responses without evidence of B cell-dependency. (D) CD19+ regulated responses; In presence of CD25+ cells, spot counts increase (>20%) when CD19+ cells are depleted. N = 11 samples. (E) CD25+ and CD19+ regulated. In absence of CD25+ cells, depletion of CD19+ cells increases spot counts (>20%). In presence of CD25+ cells, anti-donor responses are undetectable. N = 7 samples.

