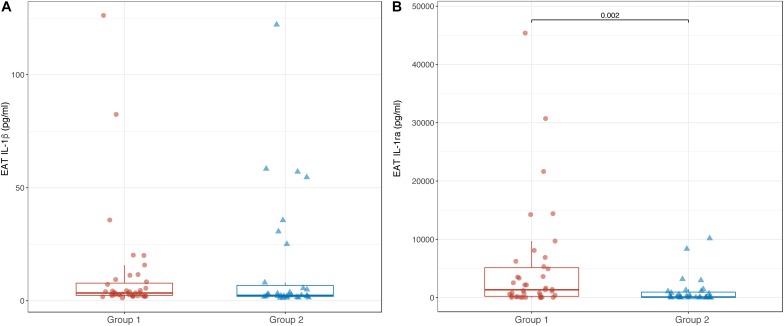
FIGURE 4.
Box-plots showing EAT levels of IL-1β (A) and IL-1ra (B) in Groups 1 and 2. Boxes are defined by Q1, median (bold line) and Q3. Whiskers reach the minimum and the maximum of the distribution except for the presence of outliers, defined as data points below Q1 – 1.5 × IQR or above Q3 + 1.5 × IQR. To avoid overlapping a small amount of horizontal jitter was added. Q1, first quartile; Q3, third quartile; IQR = Q3 – Q1.

