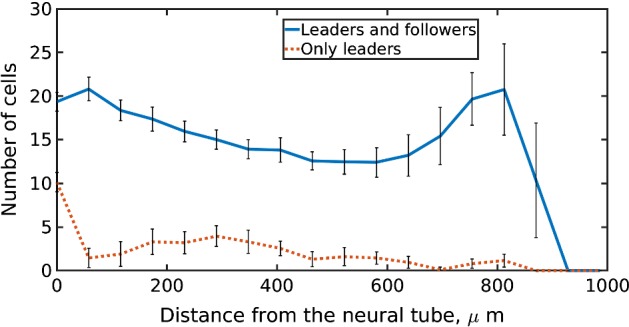
Fig. 2.

Simulation of the McLennan et al. (2015a, b, 2017) model (see text for details). Distribution of cells along the domain when there are two different cell phenotypes, namely leaders and followers, and when all the cells are leaders, average of 20 simulations after 24 h. Error bars represent standard deviation
