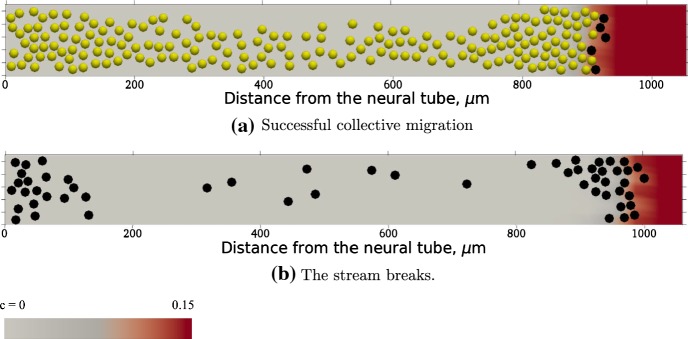
Fig. 3.
Snapshots at h from simulations of the model developed based on McLennan et al.’s (2015a, b, 2017) model (see text for details). Black circles correspond to leader cells, yellow circles correspond to follower cells, and c is the concentration of chemoattractant. In the case of two cell phenotypes (a), in which leaders guide followers by forming contact “chains”, the cells migrate collectively. If there is only cell type with cells that are guided by a cell-induced VEGF gradient, then the stream breaks (b) (color figure online)

