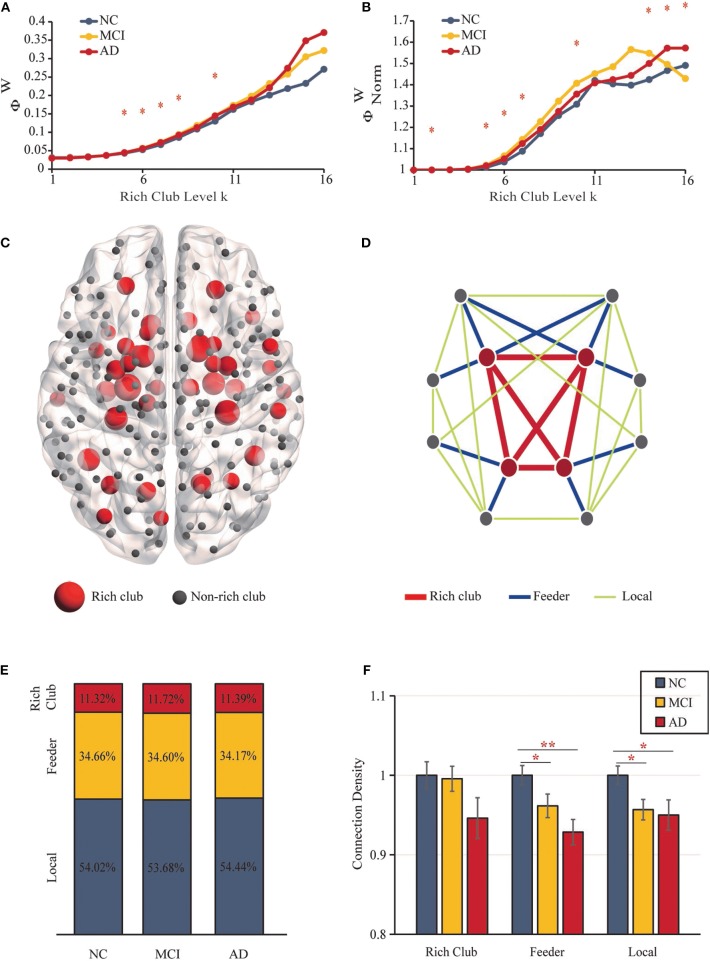
Figure 2.
Rich-Club Organization. (A) The rich-club coefficients. (B) The normalized rich-club coefficients. (C) The rich-club nodes (red nodes) are shown across all groups. (D) The different kinds of connections in structural networks. (E) The proportions of three kinds of connections for each group. (F) Bar graphs display the mean (SD) density of the rich-club, feeder and local connections (**P < 0.01, *P < 0.05).

