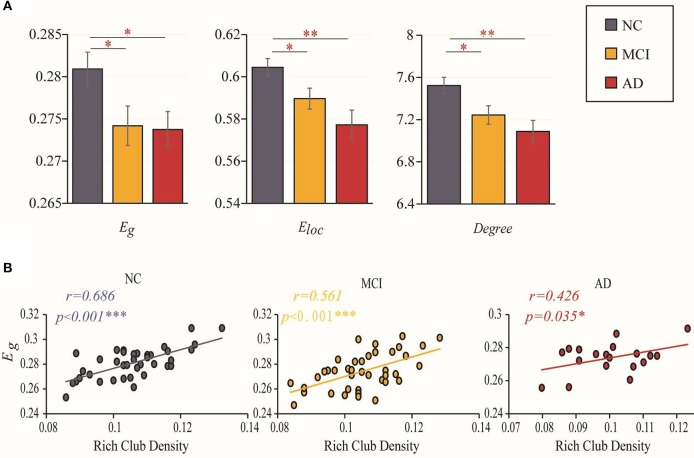
Figure 3.
Efficiency and rich-club density. (A) Bar graphs display the mean (SD) global efficiency, local efficiency and degree. (B) The correlations between the global efficiency and the density of rich-club connections. The star-labeled numbers represent significant correlations (*P < 0.05, **P < 0.01, ***P < 0.001).

