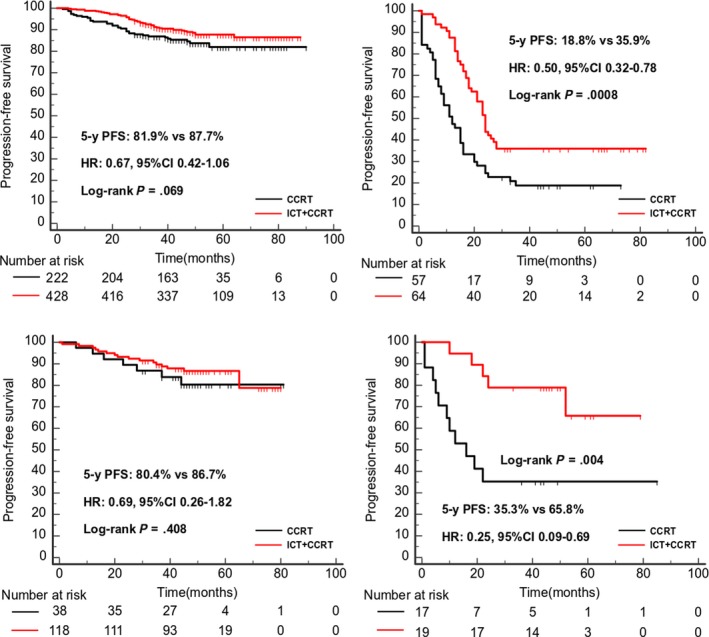
Figure 4.

Kaplan‐Meier curves of survival analysis of 5‐year PFS for patients received ICT + CCRT vs CCRT alone. A, The patients of low risk in the training cohorts; (B) The patients of high risk in the training cohorts; (C) The patients of low risk in the validation cohorts; (D) The patients of high risk in the validation cohorts
