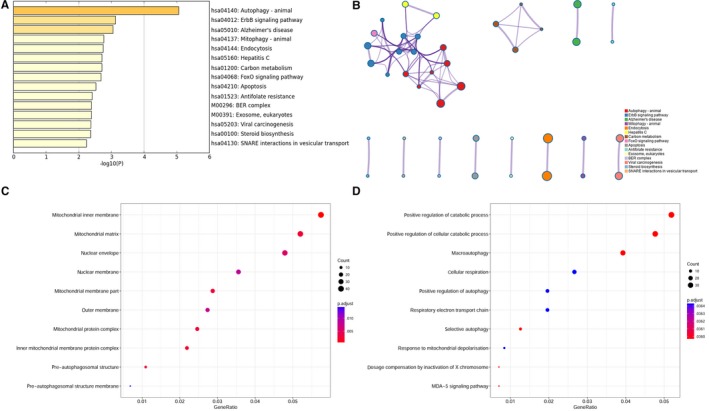
Figure 2.

A, Bar plot of enriched KEGG terms based on differentially expressed genes. Darker colors indicated smaller P values. B, Network of enriched KEGG terms was colored by cluster ID. C, Dot plot of GO enrichment of differentially expressed genes in cellular component ontology. D, Dot plot of GO enrichment of differentially expressed genes in biological process ontology
