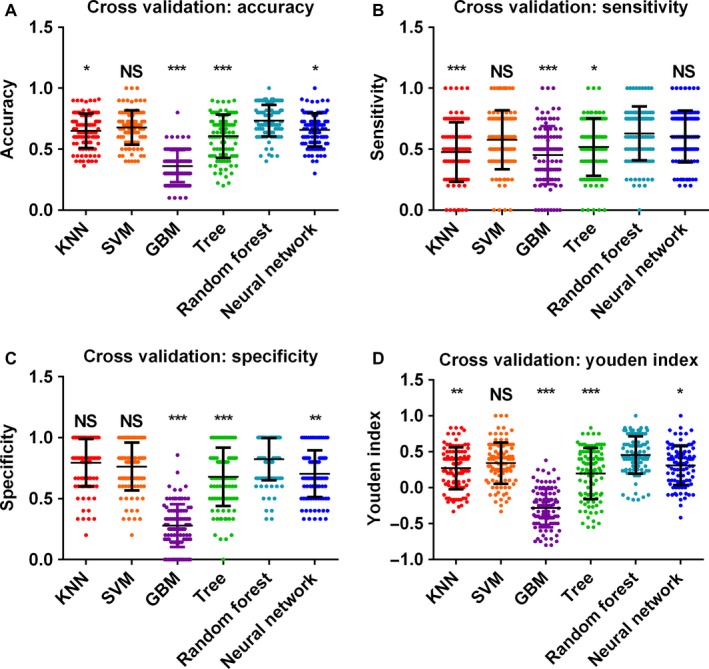
Figure 4.

Cross validation results using KNN, SVM, GBM, tree, random forest, and neural network algorithms. Model performances were determined according to prediction (A) accuracy, (B) sensitivity, (C) specificity, and (D) Youden index, each dot represented onefold of cross validation result. Results were compared by Kruskal‐Wallis ANOVA analysis, and multiple comparisons are performed by Dunn's tests. Significances were labeled between the random forest algorithm and other algorithms. *P < .05, **P < .01, ***P < .005
