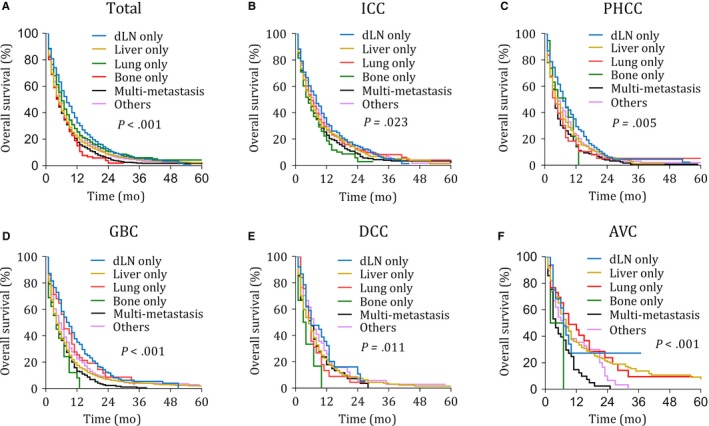
Figure 3.

Kaplan–Meier curves of overall survival according to metastasis sites in the total cohort and each subtype. AVC, Carcinoma of Vater ampulla; BTC, biliary tract cancer; DCC, Distal cholangiocarcinoma; dLN, Distant lymph node; GBC, Gallbladder cancer; ICC, Intrahepatic cholangiocarcinoma; PHCC, Perihilar cholangiocarcinoma
