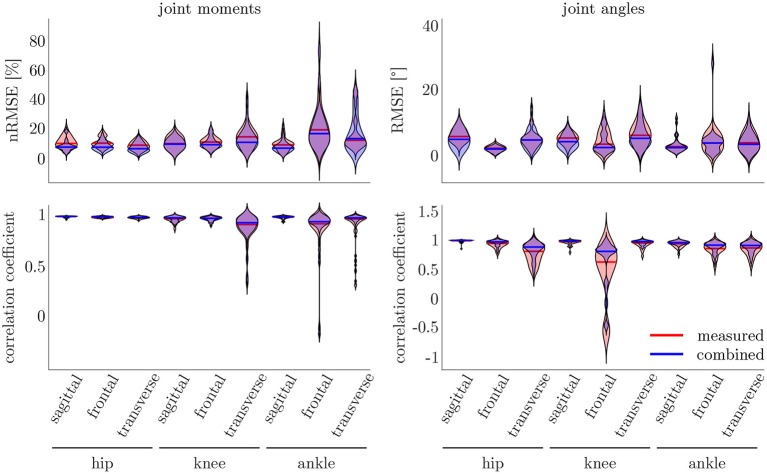
Figure 9.
On the right, the distribution of the RMSE and the correlation coefficient for the kinematic data is displayed. On the left, the distribution of the nRMSE and the correlation coefficient for the kinetic model can be found. The results for the measured data as inputs is displayed in red, while the results for the combined data inputs are displayed in blue. The violin's width displays how much data is accumulated, while the height shows the range of the distribution. The horizontal line indicates the median value of the distribution.

