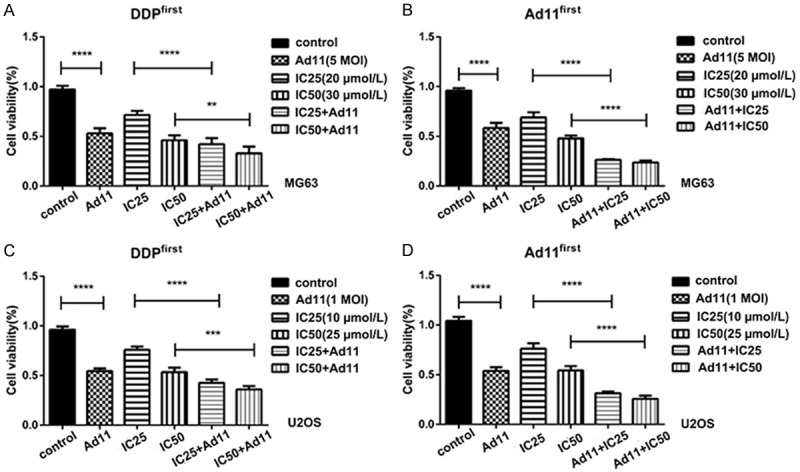
Figure 3.

Cell viability after treatment with Ad11 and DDP at different time periods. A. The concentration of DDP was IC25 = 20 µmol/l, and the MOI of Ad11 was 5 pfu/cell. B. The concentration of DDP was IC50 = 30 µmol/l, and the MOI of Ad11 was 5 pfu/cell. C, D. The same treatments using U2OS cells. (** denotes P < 0.05, *** denotes P < 0.01, **** denotes P < 0.001).
