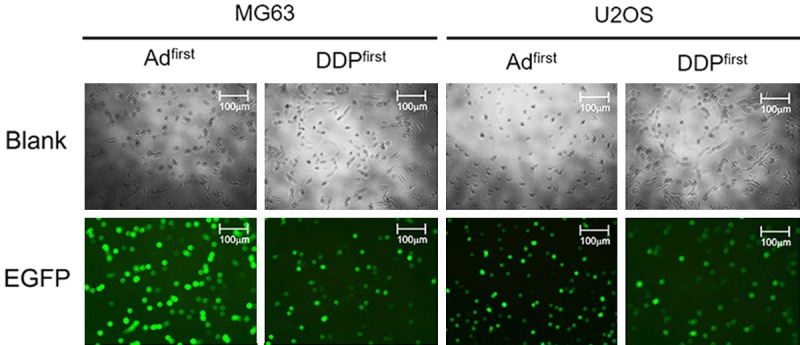
Figure 6.

Expression of EGFP after different treatments. The first column shows the results of adding the virus for 24 hours and then adding DPP for 48 hours. The second column shows the results of adding DDP for 24 hours and then adding the virus for 48 hours. The results were observed by fluorescence microscopy at 100 times magnification. The same experiment was repeated using U2OS cells. Scale bar: 100 µm.
