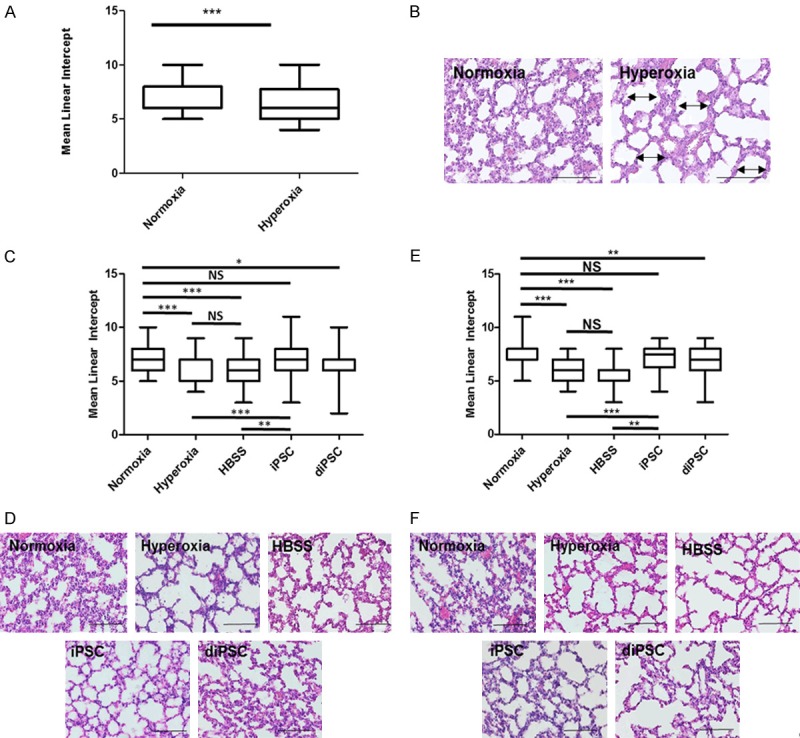
Figure 2.

Histomorphometric data of C57 BL/6 mouse lungs following 14 days of hyperoxia induced lung damage. A, C, E. Mean linear intercept values for all groups. A. Post-natal Day 15. There was a statistically significant difference between normoxia vs. hyperoxia, P<0.001. C. 7 days post cell treatment. Across all groups the statistically significant differences were seen in normoxia vs. hyperoxia, P<0.001 normoxia vs. HBSS, P<0.001 hyperoxia vs. iPSC, P<0.001 HBSS vs. iPSC, P<0.01 normoxia vs. diPSC, P<0.05. There was no statistical difference between normoxia vs. iPSC and hyperoxia vs. HBSS. *P<0.05, **P<0.01, ***P<0.001 between indicated groups. E. 14 days post cell treatment. The result was exactly the same as 7 days post cell treatment with one exception, a significant difference between normoxia and diPSC, P<0.01. B, D, F. Representative H + E staining of all groups, each image has the MLI closest to the group mean, scale bars 50 µm. B. Post-natal Day 15. The presence of alveolar simplification is indicated by double-sided arrows and septal thickening by single-sided arrows. D. 7 days post cell treatment. F. 14 days post cell treatment.
