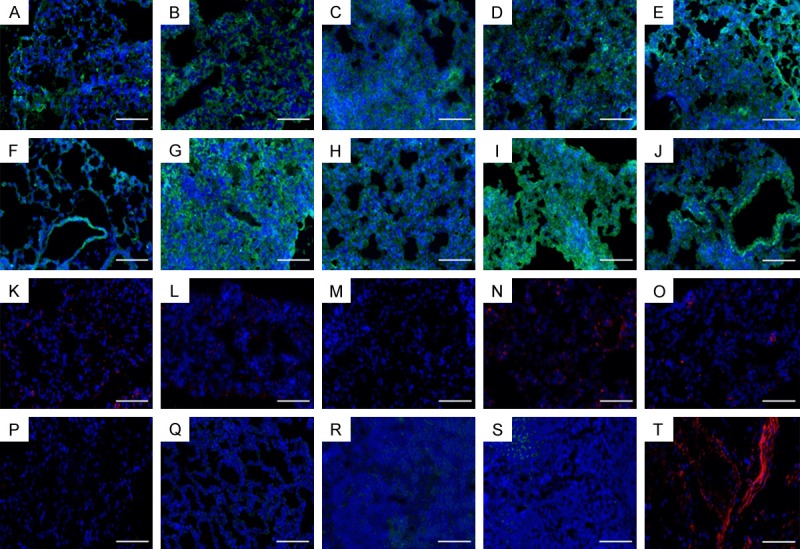
Figure 4.

Representative immunofluorescent staining of mouse lungs 14 days after treatment, scale bars 50 µm. A-E. MMP2; F-J. TGFβ1; K-O. IL6; A, F, K. normoxia; B, G, L. hyperoxia; C, H, M. HBSS; D, I, N. iPSC; E, J, O. diPSC; P. Negative Goat Anti-Rat Control; Q. Negative Goat Anti-Rabbit Control; R. Positive Control TGFβ1; S. Positive Control MMP2; T. Positive Control IL-6.
