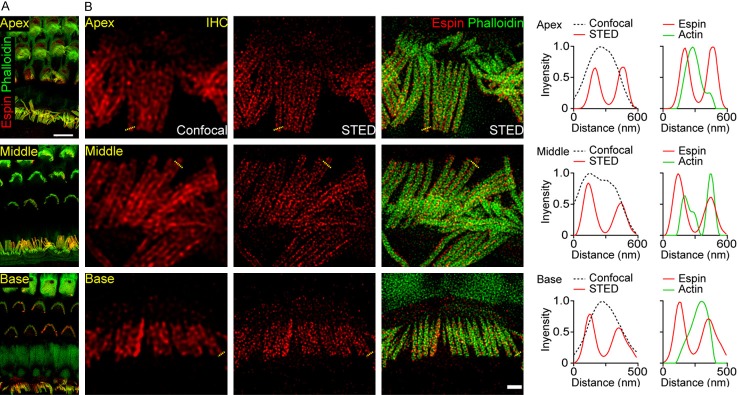
Figure 2.
Distribution of espin in different regions of the cochlea. A. Representative confocal images of espin (red) and F-actin (green) in the apical, middle, and basal turns of the cochlea from P14 mice. Scale bar, 5 μm. B. Confocal and STED images of espin (red) and F-actin (green) in IHCs from the apical, middle, and basal turns of the cochlea. Intensity profiles from the corresponding dashed lines are shown right. Scale bar, 1 μm.

