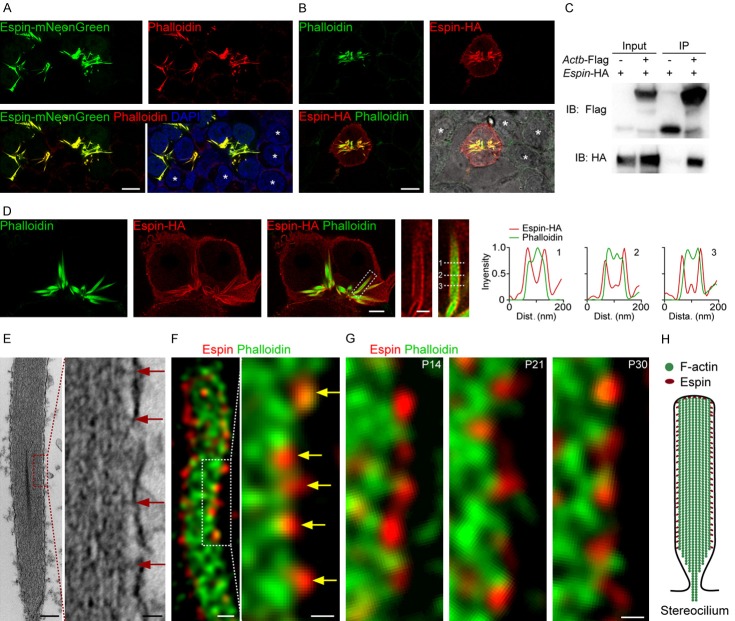
Figure 3.
Actin filaments bundled by espin in stereocilia. A. Representative confocal images of espin-mNeonGreen (green), F-actin (red) and DAPI (blue) in the Espin-mNeonGreen transfected cells. White stars indicated the non-transfected cells surrounding the transfected cells. Scale bar, 10 μm. B. Representative confocal images of espin-HA (red) and F-actin (green) in the espin-HA transfected cell. The bright-field image to the lower-right shows the individual cells in the captured region. White stars indicate the non-transfected cells surrounding the transfected cell. Scale bar, 10 μm. C. Co-immunoprecipitation of espin and actin. Human HEK293T cells were transfected with the FLAG, Actb-FLAG, or Espin-HA constructs. Immunoprecipitations were carried out with FLAG antibodies followed by western blotting to detect co-expressed proteins using the HA antibody. Representative images from three independent experiments are shown. D. Representative confocal images of espin-HA (red) and F-actin (green) in the espin-HA-transfected cells, with magnification of the white boxed regions to the right. Scale bars are 4 μm and 1 μm, respectively. The dashed lines are numerically labeled, and the corresponding intensity curves along the dashed lines are shown. E. Transmission electron microscopy image of a stereocilium with its magnification. Red arrows indicate the actin-membrane linkages. Scale bars are 200 nm and 25 nm, respectively. F. Representative STED images of a stereocilium with its magnification, co-labeled with espin (red) and F-actin (green). Yellow arrows indicate the espin punctas between the edge of the actin filaments and the membrane. Scale bars are 200 nm and 100 nm, respectively. G. Representative magnified STED images of stereocilia at different development stages after birth, co-labeled with espin (red) and F-actin (green). Scale bar, 100 nm. H. Functional model of espin in the a stereocilium.

