Figure 5.

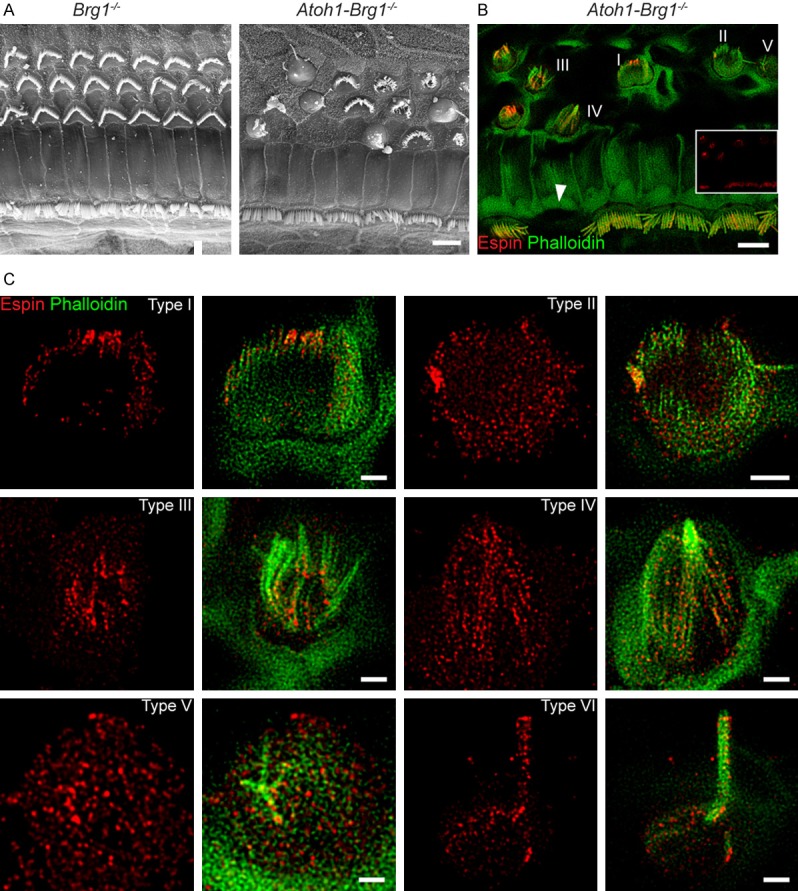
Altered espin distribution in OHCs from Atoh1-Brg1-/- mice. A. Representative SEM images of the organ of Corti from adult Brg1-/- and Atoh1-Brg1-/- mice. Scale bar, 5 μm. B. Representative confocal images of the organ of Corti from adult Atoh1-Brg1-/- mice. The espin signal from the same optical field is shown in the insert image. Red, espin. Green, F-actin. Numbers I-V indicate impaired OHCs with different morphologies. White triangle indicates the occasional missing IHC in adult Atoh1-Brg1-/- mice. Scale bar, 5 μm. C. STED images of espin (red) and F-actin (green) in different OHC morphologies in adult Atoh1-Brg1-/- mice. Scale bars, 1 μm.
