
Figure 5.
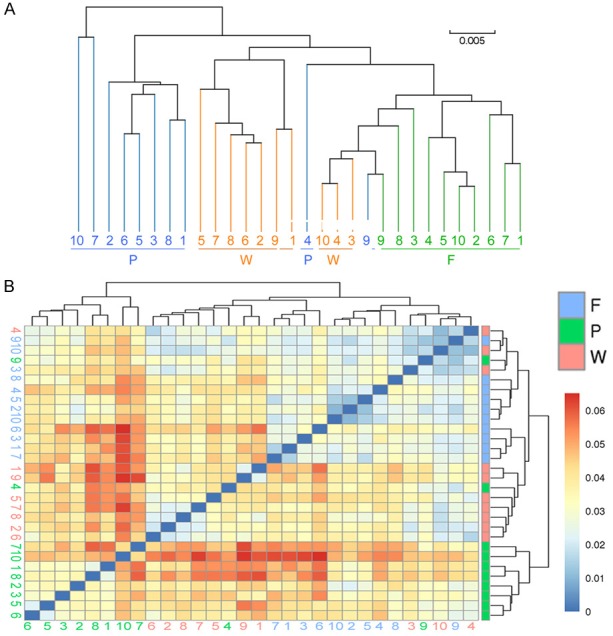
Hierarchical clustering analysis of the 16S rRNA v3+v4 sequencing results of the gut microbiota of feces from various groups of mice. A. Results of UPGMA analysis showed that the gut microbiota of mice in groups F and WT exhibited high homology and similar genetic backgrounds. B. Heatmap analysis of samples from various groups based on the distance algorithm (unweighted).