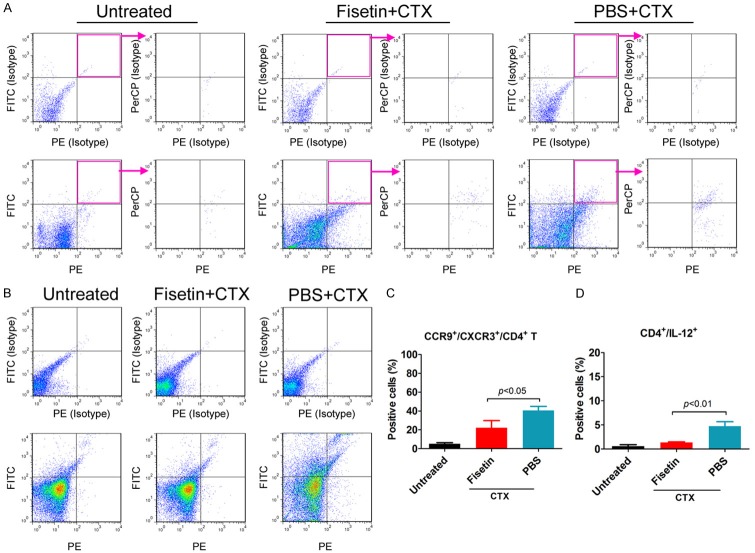
Figure 9.
Analysis of peripheral blood CCR9+/CXCR3+/CD4+ T-lymphocyte counts and IL-12 levels in various groups of mice. A and C. FCM analysis showed that the peripheral blood CCR9+/CXCR3+/CD4+ T-lymphocyte count of mice in the fisetin group was significantly lower than that of mice in the control group; B and D. FCM analysis showed that the peripheral blood CD4+/IL-12+ cell count of mice in the fisetin group was significantly lower than that of mice in the control group.

