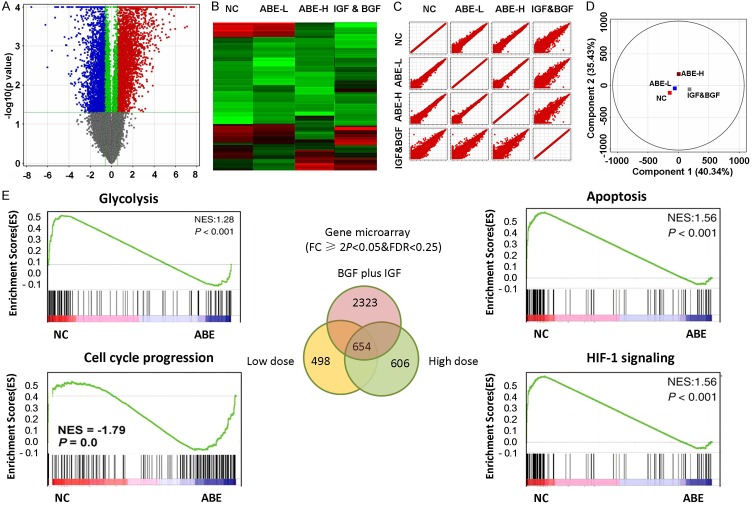
Figure 2.
Gene expression profiles revealed ABE predominately targeting glycolysis and apoptosis pathway. A. Volcano plots were used to visualize the differentially-expressed genes among different conditions. Vertical lines correspond to 2.0 folds (log2 scaled) were assigned as up-regulation and down-regulation, respectively. The horizontal line represented a P-value of 0.05 (-log10 scaled). The red and blue points in plot represent the differentially expressed genes with statistical significance. B. Heatmap and hierarchical cluster analysis of the most up and down regulated genes. C. Scatter plots were used to evaluate the difference in the expression of genes between experiment group and control group. Values plotted on the X and the Y axes were the mean normalized signal values for each group (log2 scaled). D. PCA plot revealed the expression profiles in the indicated groups showed good separation. E. GSEA was used to identify the most enriched signaling pathways. Top enriched pathways were showed.

