Figure 3.
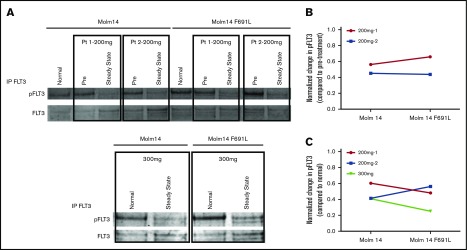
PIA shows gilteritinib is active against FLT3-ITD/F691L at clinically achievable plasma concentrations. (A) Western blot analysis for phosphotyrosine and total FLT3 performed after immunoprecipitation using anti-FLT3 antibody on lysates prepared from parental Molm14 cells and Molm14 cells expressing the FLT3-ITD/F691L mutation. Cells were exposed for 120 minutes to healthy normal control or pretreatment (pre) and steady-state plasma obtained from patients treated with gilteritinib at the 200 or 300 mg daily. Quantification of PIA data shown in panel A indicating reduction in normalized phospho-FLT3 (pFLT3) levels at steady-state timepoint compared with pretreatment (B) or normal (C) control plasma. Phosphotyrosine and total FLT3 band was quantified on a Licor Oddyssey imager and phosphotyrosine value was normalized to total FLT3 to derive normalized pFLT3 level. Data shown are ratios of steady-state to pretreatment normalized pFLT3 levels. Data represent a single experiment.

