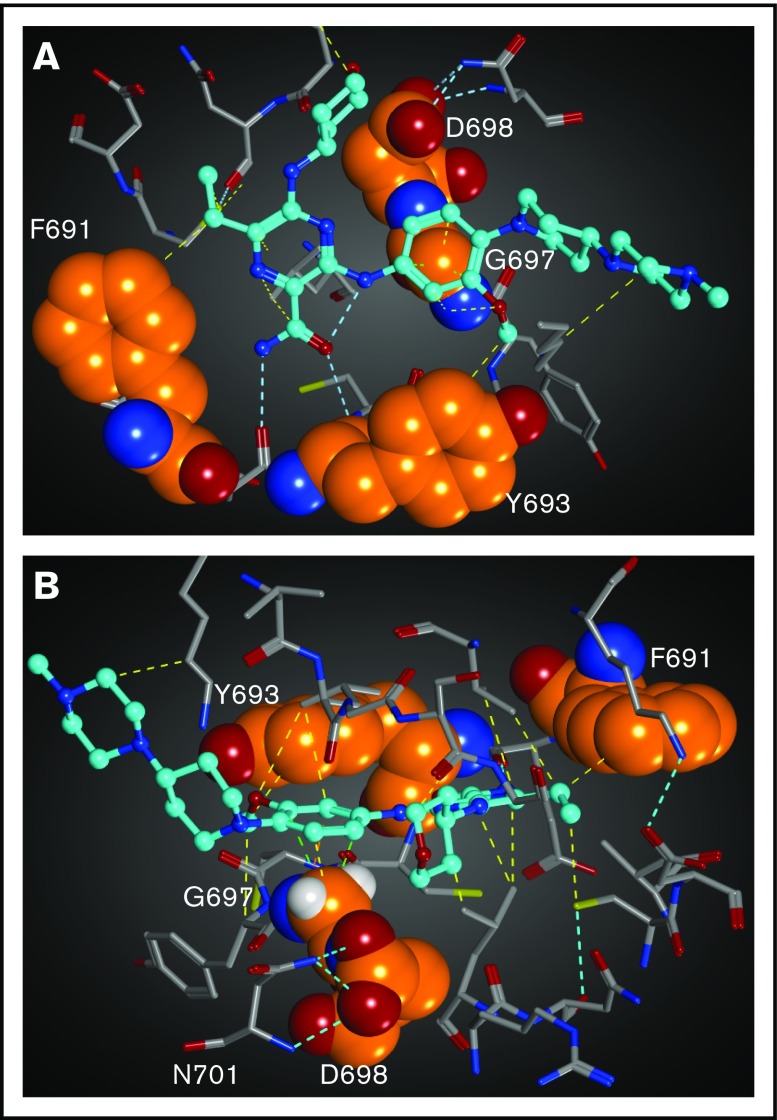
Figure 4.
Structural mapping and interaction network of the gilteritinib-resistant mutations in FLT3. The residues for which mutations have been identified from the in vitro saturation mutagenesis screen are represented as spheres. Gilteritinib is shown as a ball-and-stick model. All of atoms are colored by the type of element (white: hydrogen; cyan, gray, and orange: carbon; blue: nitrogen; red: oxygen, yellow: sulfur). For clarity, the hydrogen atoms are omitted. Molecular interactions are shown as dotted lines and colored by the type of interaction (cyan: hydrogen bond; yellow: via van der Waals interaction; light green: CH−π interaction). (A) Gilteritinib bound to FLT3. The residues in front of the gatekeeper residue F691 is hidden. (B) Another view of gilteritinib bound to FLT3. The hydrogen atoms of G697 are shown.

