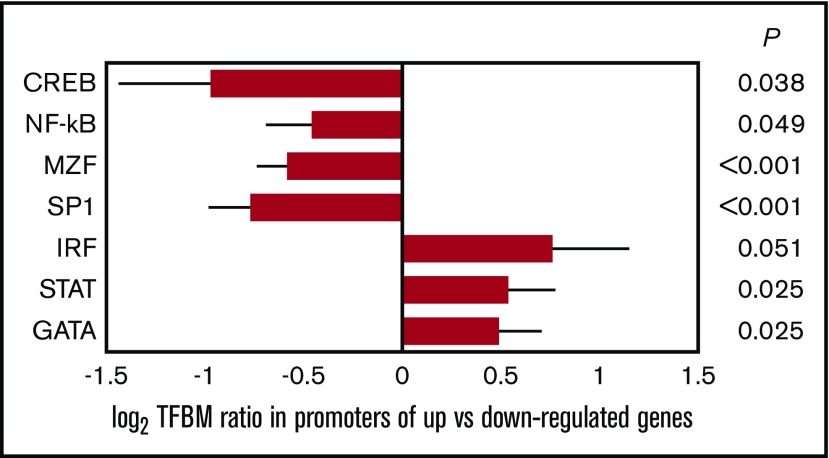
Figure 4.
Bioinformatic measures of TF activity. Data represent log2 ratio TFBM prevalence within the promoters of genes showing relative upregulation vs downregulation in PBMC samples from propranolol-treated patients relative to controls. Results are provided for TF pathways positively associated with CTRA biology (β-adrenergic–responsive CREB, myeloid-linked MZF, and proinflammatory NF-κB) and negatively associated with CTRA biology (IFN-related IRF and STAT and lymphoid-linked GATA). Error bars indicate SE.

