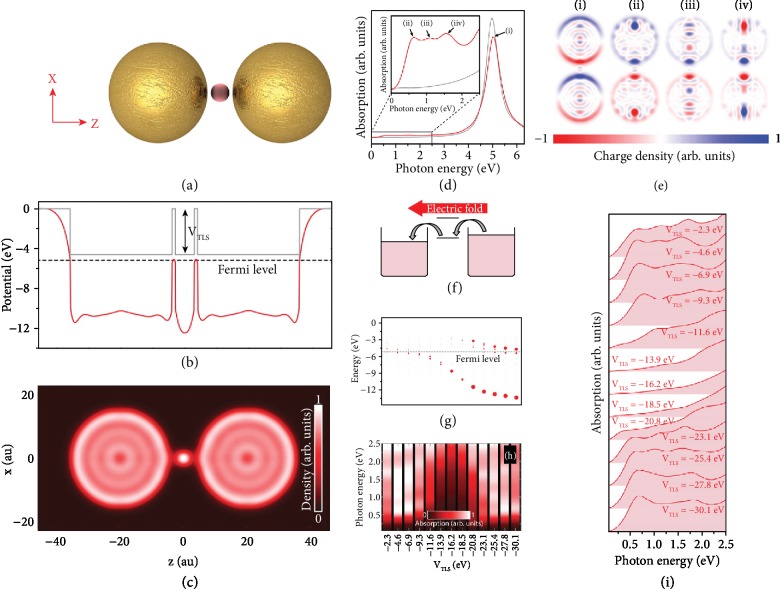
Figure 3.
(a) An artistic sketch of the studied two-level system. (b) One-electron potential (red) and background potentials in equilibrium. The corresponding Fermi level of the nanoplatform is represented by a dashed black line. (c) Equilibrium electronic density of the given system. (d) The calculated absorption spectrum for both bare (gray) and TLS added (red) dimer. Inset: zoomed-in version of the low-energy area. (e) Corresponding charge plots of the induced modes at (i) 5.05 eV, (ii) 0.65 eV, (iii) 1.10 eV, and (iv) 1.55 eV. (f) A schematic to denote the physical mechanism behind the generation of CTP mode. (g) The electronic structure of the system as a function of background potential of TLS. The black dashed line displays the Fermi level of the platform. (h, i) Two different versions of the absorption spectra of the system as a function of VTLS [71]. Copyright 2015, American Chemical Society.

