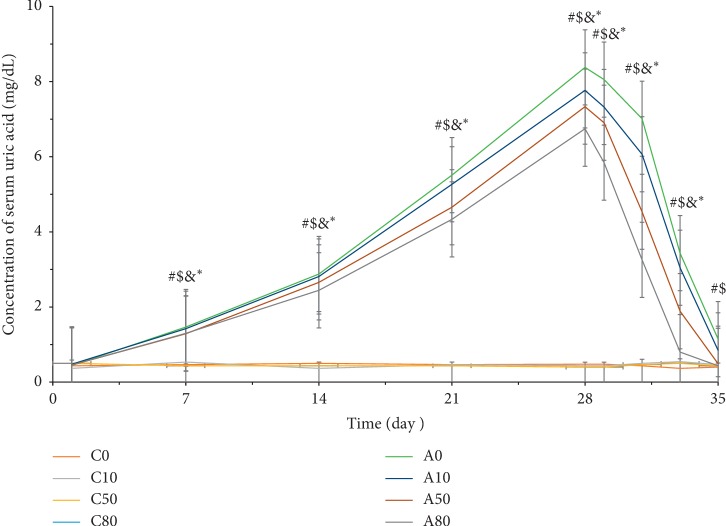
Figure 4.
The concentration of serum uric acid changes in amelioration of hyperuricemia during OA induction and oxygenated water treatment. Data are expressed as means ± S.E.M. (n = 10) (#p value <0.05 of A0 compared to C0; $p < 0.05 of A10 compared to C10; &p < 0.05 of A50 compared to C50; ∗p < 0.05 of A80 compared to C80).

