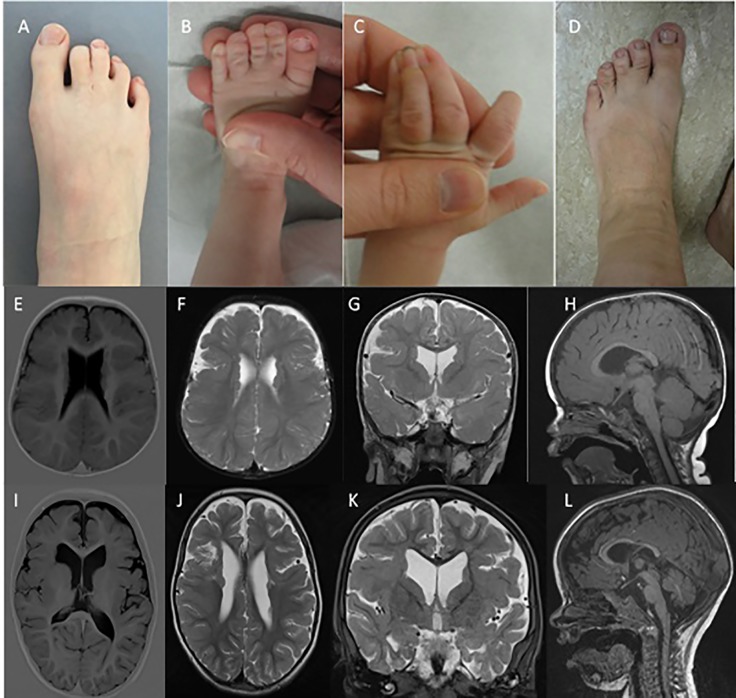
Figure 1.
Syndactyly phenotypes and brain MRI. (A D) indicate the presence of variable syndactyly in case 1 (A), case 2 (B, C), and the mother of case 2 (D). Brain MRIs of case 1 (E–H) and case 2 (I–L). Mild ventricular dilatation, bilateral PNH, and bilateral PMG are demonstrated in both cases (E-G, I-K). (H, L) demonstrate thinning of the corpus callosum with normal infratentorial findings.

