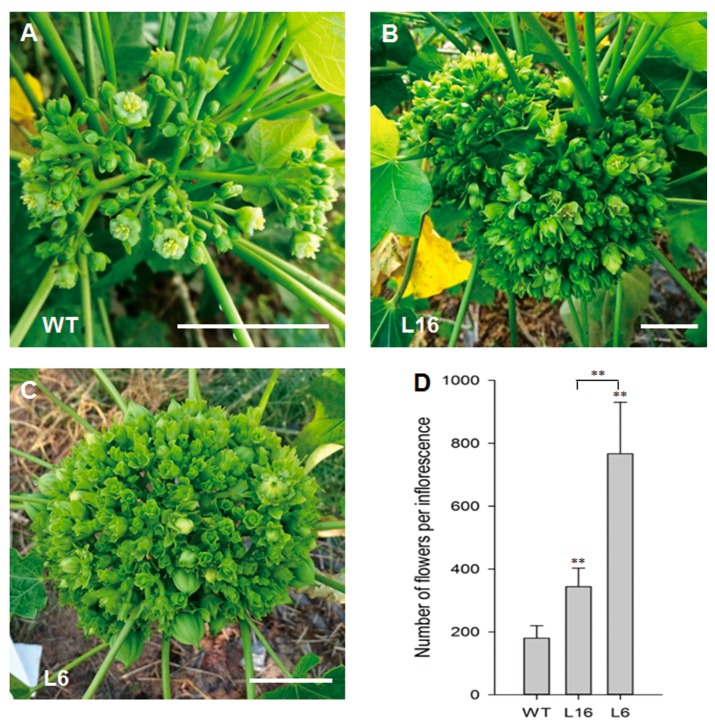
Figure 3.
The flower number per inflorescence was increased in JcTM6:AtIPT4 transgenic J. curcas. (A–C) Inflorescences of WT plants (A) and the transgenic lines L16 (B) and L6 (C); scale bars = 3 cm. (D) Number of flowers per inflorescence in WT and transgenic J. curcas. The values represent the means ± standard deviations (n = 8). Student’s t-test was used for the statistical analyses: ** p ≤ 0.01.

