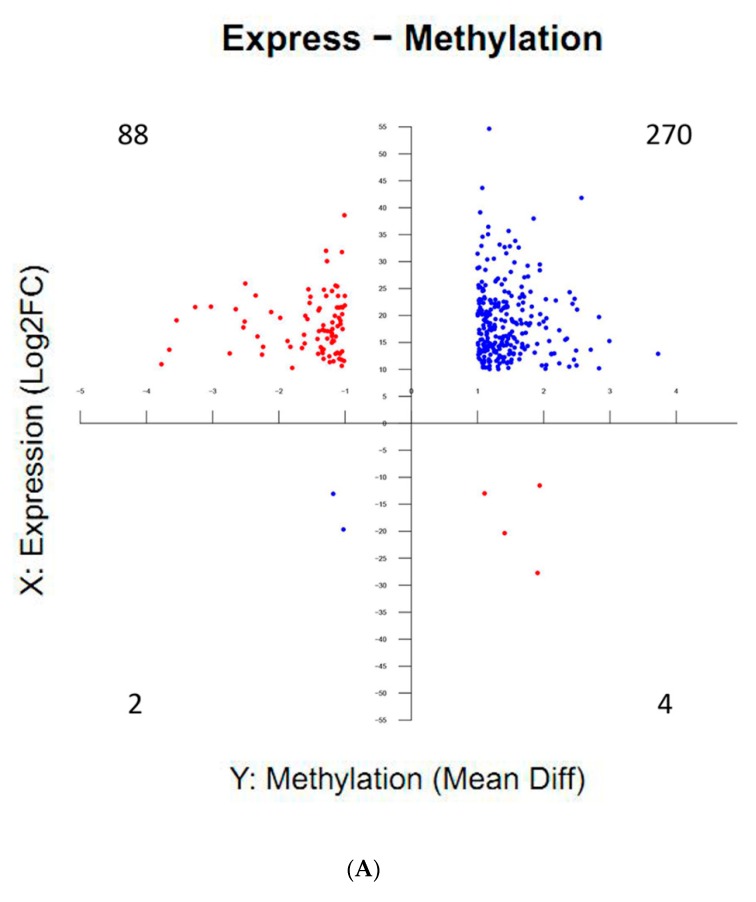
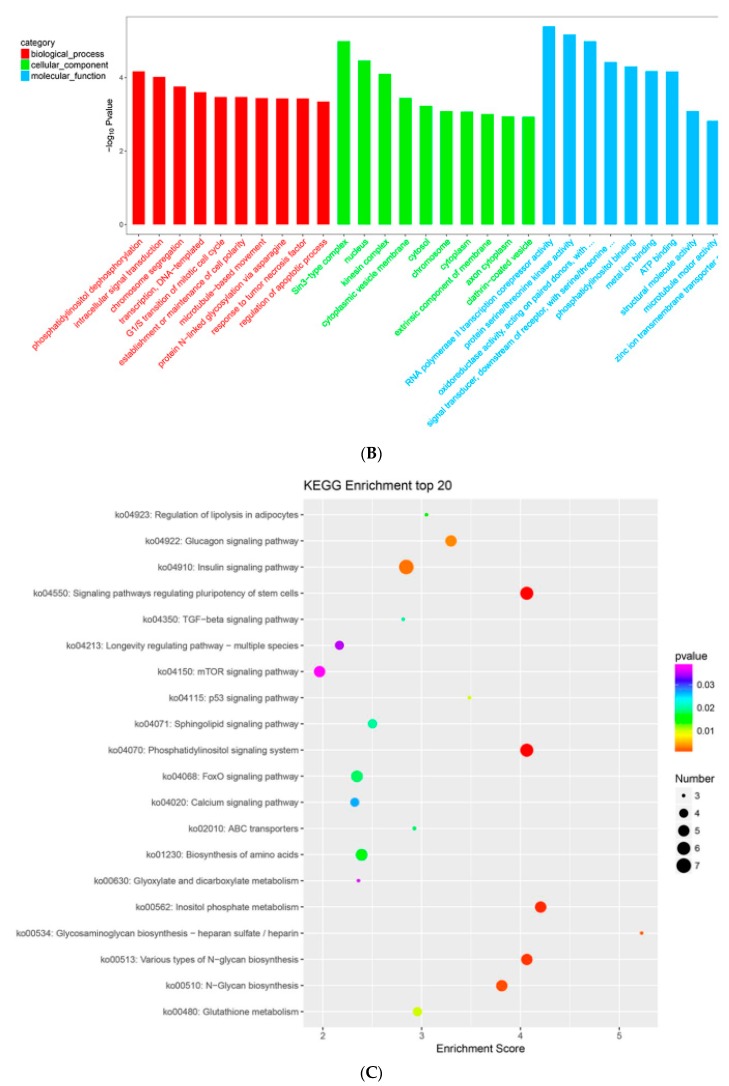
Figure 8.
Distribution and functional enrichment analysis of significant differences in methylation and expression levels in methylome- and transcriptome-associated genes (MTGs). The distribution of MTGs in four different quadrants; the number in each quadrant refers to the number of MTGs in that quadrant (A). MTGs were classified into cellular components, molecular function and biological processes by WEGO according to GO terms (B). KEGG pathway enrichment of MTGs. The circle size represents gene numbers, and the colour represents the Q value (C).


