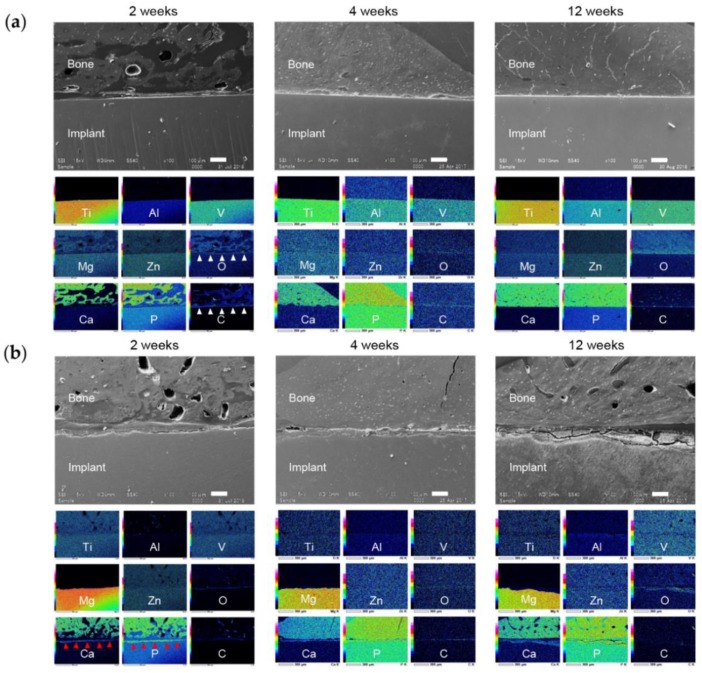
Figure 11.
Representative SEM images and energy dispersive X-ray spectroscopy (EDX) elemental mapping of the bone-implant interface. (a) TiA and (b) MgA implants. SEM image, 100× magnification. Scale bars at lower right, 100 μm. EDX elemental mapping corresponds to the SEM image. White arrowheads indicate fibrous tissue (existence of O and C), red arrowheads indicate new bone formation (existence of Ca and P).

