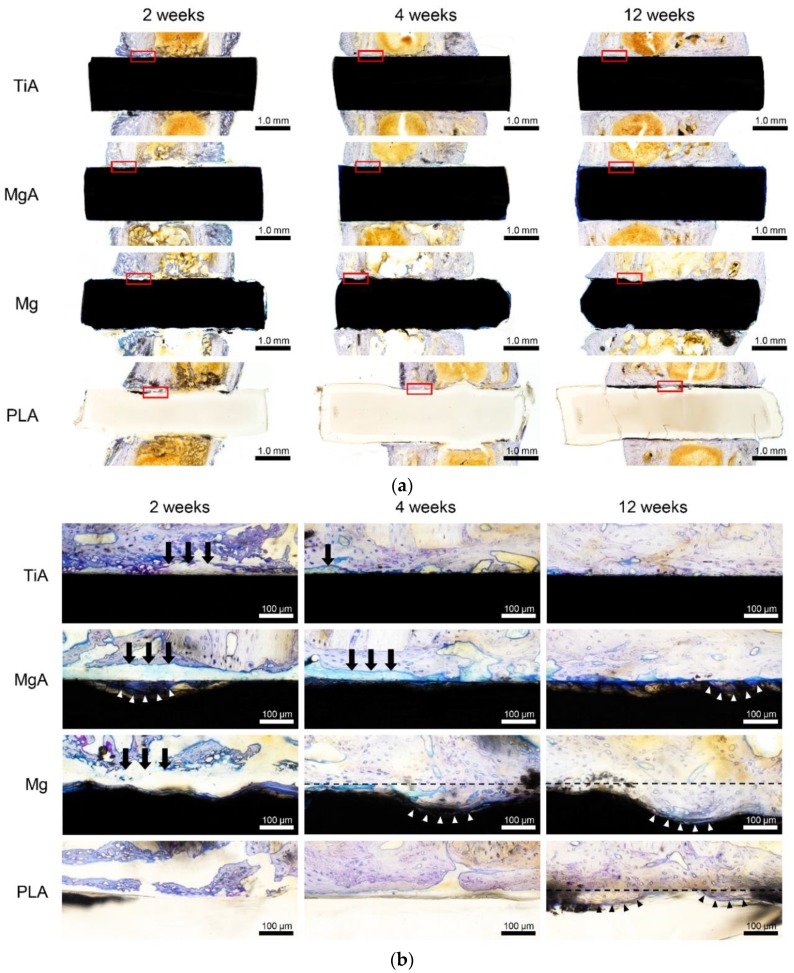
Figure 13.
Representative toluidine blue-stained image of bone tissue surrounding the implants. (a) Low and (b) high magnification images; the red box in (a) is magnified in (b). In the markedly degraded sample, the black broken line indicates the initial interface. Arrows indicate fibrous tissue between implant and bone, arrowheads indicate new bone formation to the absorbed implant area.

