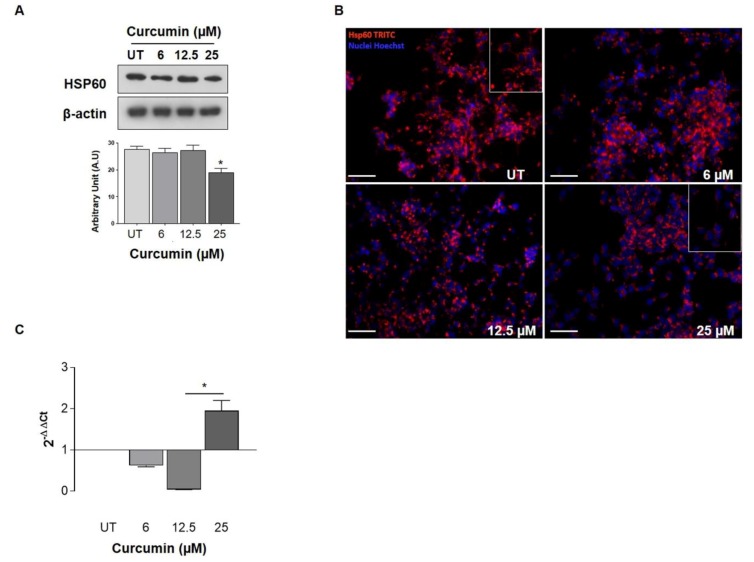
Figure 2.
Effect of curcumin treatment on HSP60 expression level (A) Representative Western blots and graph of densitometry of the corresponding bands for HSP60 protein expression level in UT, 6 µM, 12.5 µM, and 25 µM of curcumin. β-actin was used as an internal control (* Different than UT, 6 µM, and 12.5 µM, p < 0.01). Statistical analysis was performed using ANOVA analysis of variance followed by a Bonferroni post-hoc test. Experiments were performed in quadruplicate. (B) Immunofluorescence images confirming the data (Bar: 30 µm). The chaperonin seems to be confined to mitochondria. The insets were obtained using the NIH Image J 1.40 analysis program (National Institutes of Health, Bethesda, MD, USA). (C) Representative graph showing real-time PCR analysis of HSPD1, (heat shock protein family D, HSP60 member 1) gene expression. The data were normalized to reference genes according to the Livak Method (2−ΔΔCt). (* Different than UT p < 0.05).

