Figure 4.
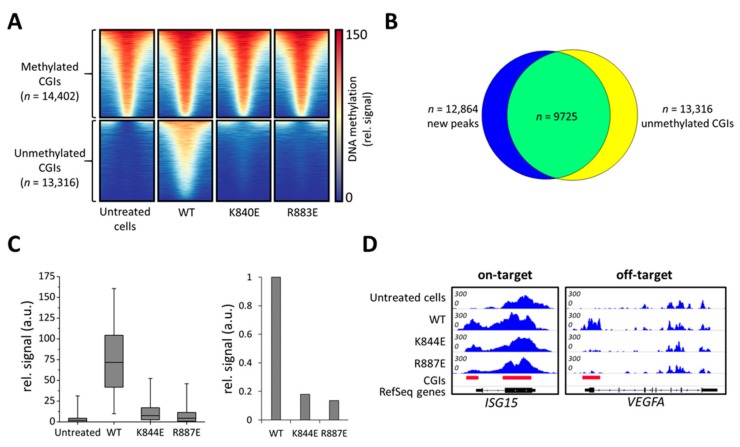
Genome-wide analysis of off-target DNA methylation in cells treated with dCS, Ab-3A3L with wild type or mutant DNMT3A parts, and ISG15 sgRNA. (A) Heatmap showing DNA methylation centered around CGIs ± 1 kb. Untreated cells contain methylated and unmethylated CGIs, which are separated into two groups shown in the upper and lower panels. The wild type DNMT3A (WT) construct caused a very strong de novo methylation in previously unmethylated CGIs, whereas K844E and R887E showed drastically lower methylation. (B) Intersection of new DNA methylation peaks generated by the wild type DNMT3A (WT) and the group of unmethylated CGIs taken from (A). (C) Boxplot showing a quantification of MBD-seq data sets using the group of unmethylated CGIs from (A) (line = median, box = 25th and 75th percentile, whiskers = 5th and 95th percentile). The bar diagram shows average signals in unmethylated CGIs normalized to wild type (WT). (D) Integrative Genomics Viewer (IGV) browser views of MBD-seq data displayed for the ISG15 (chr1:948,441-950,302, hg19) and VEGFA (chr6:43,736,149-43,754,992, hg19) regions. For quantification and additional off-target loci, see Figures S4 and S5.

