
Figure 2.
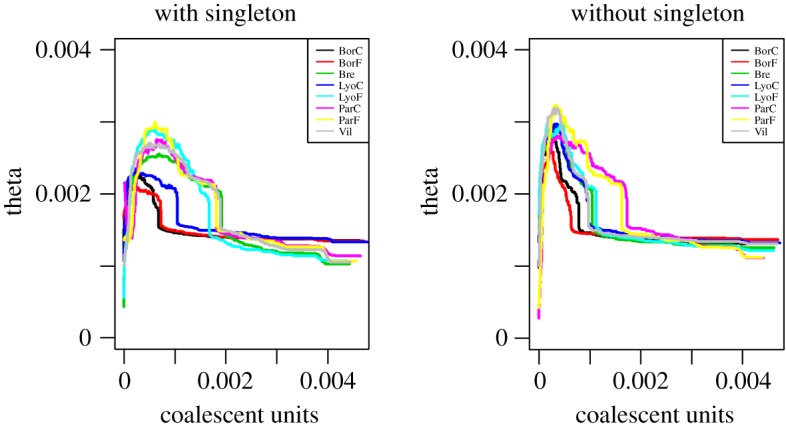
Maximized composite likelihood of Θ through time obtained through the stairwayplot method on the folded SFS. The inferred effective size Θ is plotted, from left to right, from present time (0) to the past (in scaled units of time). (Online version in colour.)