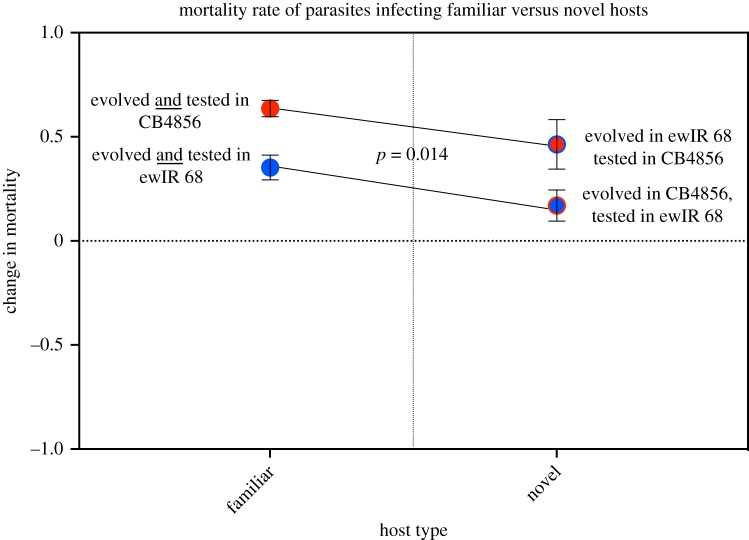
Figure 2.
Each dot represents the treatment's average change in mortality rate of all populations and replicates relative to ancestral parasites. All experimental populations shared a common ancestor, and thus, any change from the ancestral data is indicative of relative virulence. The x-axis shows the type of host infected: either familiar to the parasite or novel. The p-value is based on a post-GLM Tukey contrast test between all familiar hosts (left panel) and all novel hosts (right panel) (χ2 = 6.04, p = 0.01). In both cases, although all treatments had an increased mortality rate relative to the ancestor, novel hosts had a lower mortality rate than do the familiar hosts. Bars around mean represent s.e.m. (Online version in colour.)

