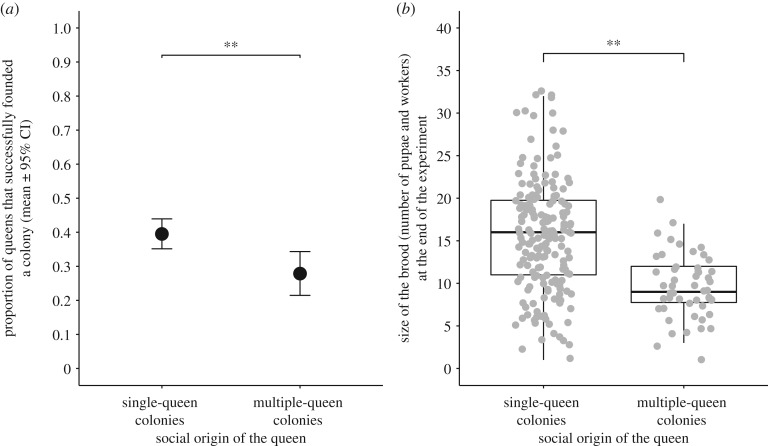
Figure 2.
(a) Proportion of queens that successfully founded a colony throughout the experiment. **p = 0.02. These data include queens that died before winter. (b) Size of the brood at the end of the experiment. Each point represents a queen. Only live queens with at least one worker are included. The data inside each box include the median and the 1st and 3rd quartiles. **MCMCglmm-p < 0.001. The winter condition did not predict brood size.

