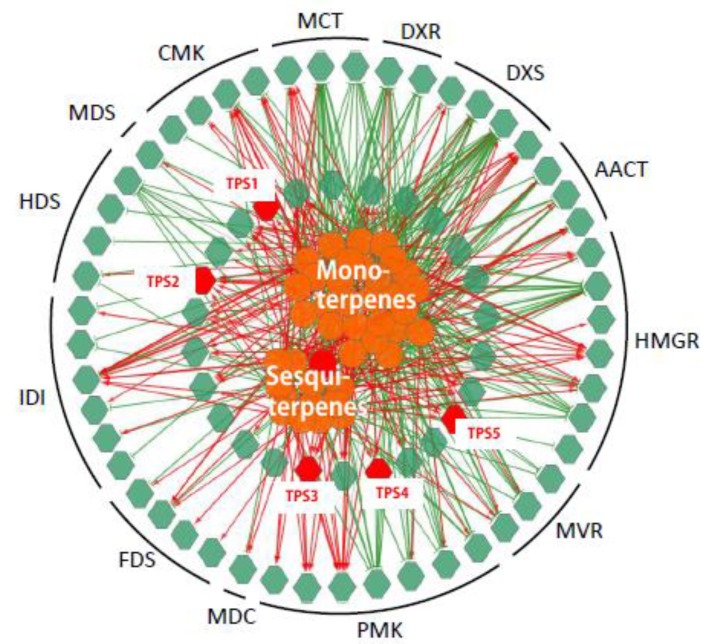
Figure 4.
Correlation networks generated by the integration of expression levels of genes and terpenoids accumulation. The networks were generated by the integration of the expression levels (reads per kilobase per million (RPKM) value) of 75 (of 82) genes (green hexagons) and the accumulation of 41 terpenoids (orange circulars) using Pearson partial correlation analysis (r > 0.8 or r < −0.8, p < 0.05). Red hexagons, genes related to farnesene, named TPS1-5. Red links, positive correlation (r > 0.8): green links, negative links (r < −0.8).

