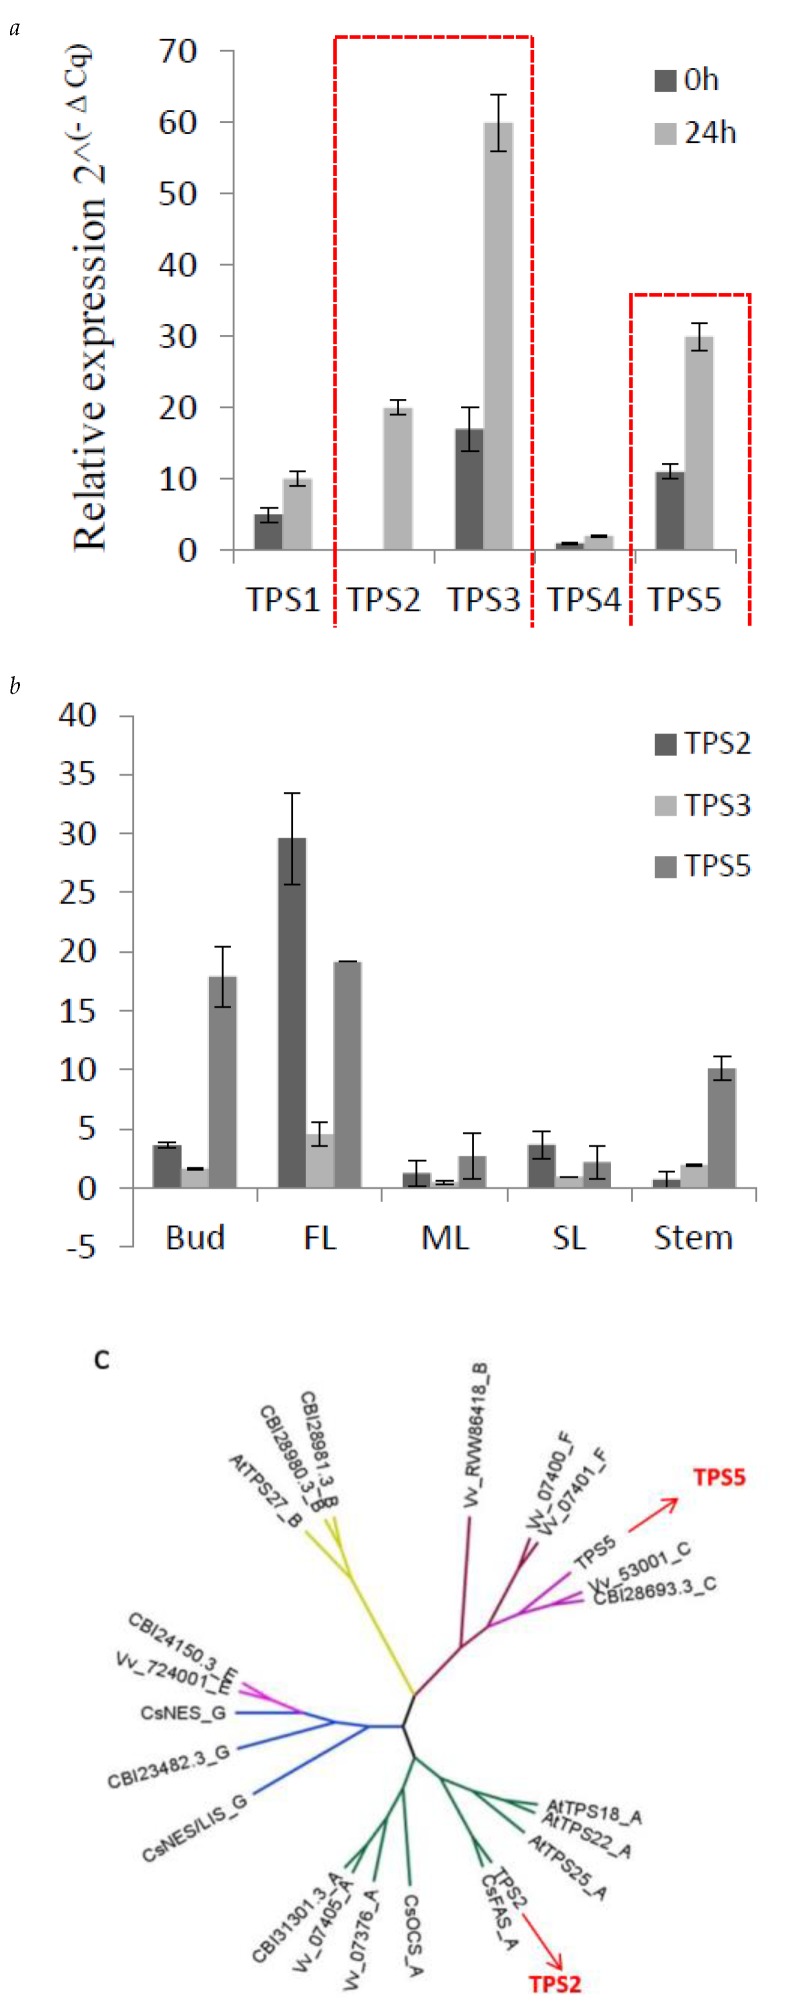
Figure 5.
Expression of three TPSs in different tissues and their response to MeJA. (a) q-PCR results of the expression level of TPS1-TPS5 responds to MeJA, red line to highlight the changes of TPS2, TPS3 and TPS5. (b) q-PCR showing the different expression levels of TPS2, 3 and 5 in five tissues, (c) the phylogenetic tree of TPS2 and TPS5, which was obtained by using MEGA-7 software with the neighbor-joining method. At, Arabidopsis thaliana; Vv, Vitis vinifera; CsAFS, α-farnesene synthase in Camellia sinensis; CsOCS, β-ocimene synthase in Camellia sinensis; CsNES, nerolidol synthase in Camellia sinensis; CsNES/LIS, nerolidol/linalool synthase in Camellia sinensis.

