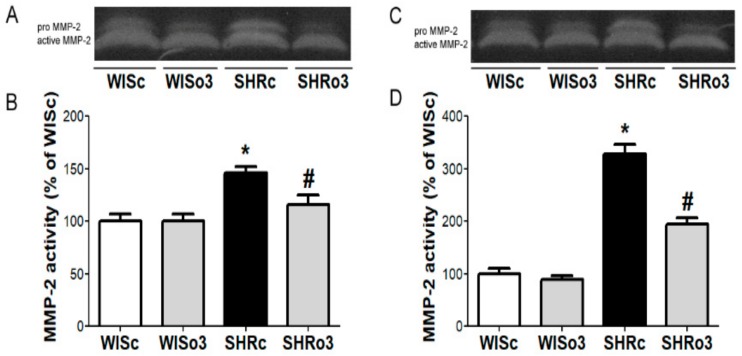
Figure 3.
Representative images of zymography (A,C) and matrix metalloproteinase-2 (MMP-2) activity (B,D) in the left ventricles of male (left panel, A,B) and female (right panel, C,D) normotensive and hypertensive rats fed with omega-3. WISc—wistar control rats; WISo3—WISc fed with omega-3; SHRc—spontaneously hypertensive rats; SHRo3—SHRc fed with omega-3. n = 6 in each group. Data are presented as means ± SEM; * p < 0.05 versus WISc; # p < 0.05 versus SHRs.

