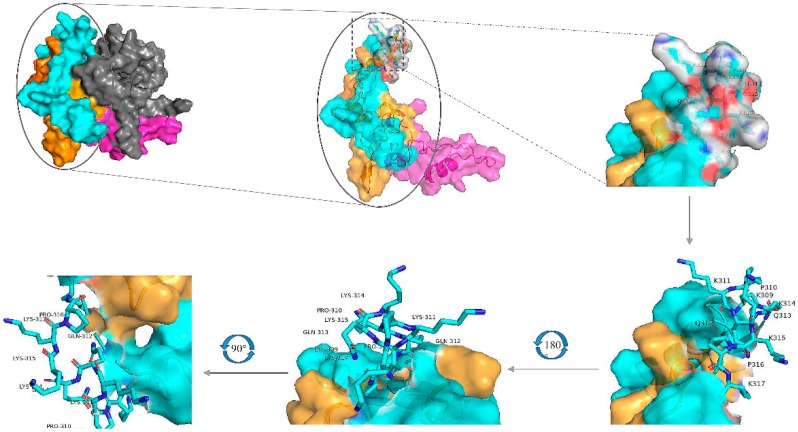
Figure 7.
Model of the I-TASSER predicted 3D structure of the N-protein, visualized using the PyMOL molecular graphics and modeling system. The overall structure is shown on the upper left, the yellow areas represent aa231-291, blue areas represent aa292-342, grey areas represent aa1-171, and pink areas represent aa172-230. The EP-4E88 residues (aa 309-KPKQQKKPK-317) are shown as a stick figure and are displayed at different angles of rotation.

