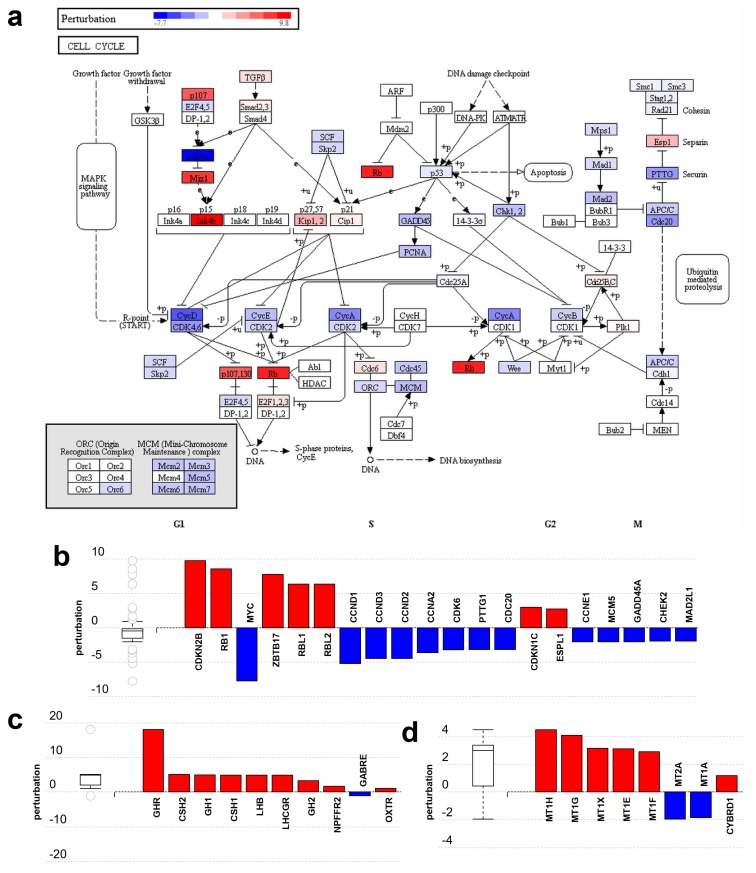
Figure 5.
Gene perturbation analysis by iPathwayGuide: Perturbation of non-placental-module genes in the cell cycle pathway (KEGG:04110). (a) The pathway diagram is overlaid with the computed perturbation of each gene. The perturbation accounts both for the gene’s measured fold change and for the accumulated perturbation from any upstream genes. The highest negative perturbation (−7.7) is shown in dark blue, while dark red represents the highest positive perturbation (9.8). Note: For legibility, one gene may be represented in multiple places in the diagram and one box may represent multiple genes in the same gene family. For each gene family, the color corresponding to the gene with the highest absolute perturbation is displayed. (b) Gene perturbation bar plot. All the genes in the cell cycle pathway are ranked based on their absolute perturbation values. For each gene, the signed perturbation is represented with negative values in blue and positive values in red. The box and whisker plot on the left summarizes the distribution of all gene perturbations in this pathway. (c,d) show placental-module genes perturbed in the neuroactive ligand-receptor interaction pathway (KEGG:04080) and the mineral absorption pathway (KEGG:04978), respectively. Figures were generated by iPathwayGuide.

