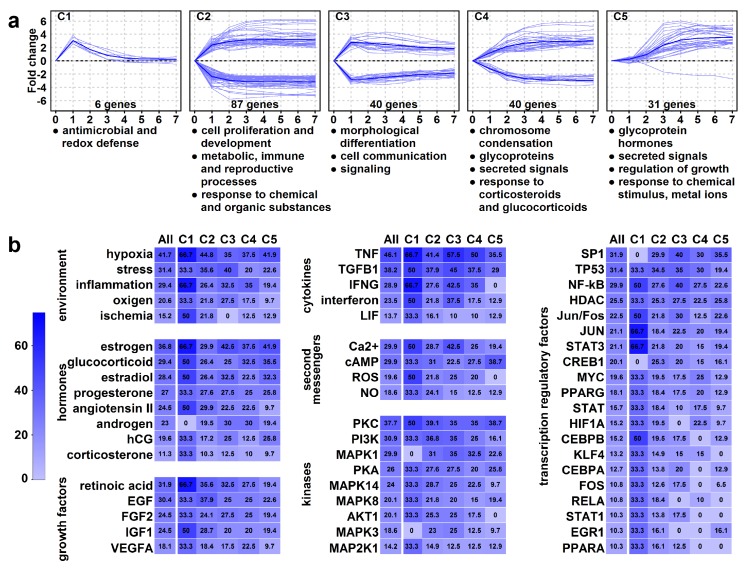
Figure 7.
Genes with high expression change (HEC). (a) The graphs show the temporal expression pattern of genes in the clusters. Individual gene expression data (log2-fold change compared to day 0 is depicted with light blue lines, while mean cluster gene expression data is shown with dark blue lines. Cluster enrichments were assessed using DAVID, the significance threshold was set at FDR < 0.2. The biologically most relevant, terms were listed below the clusters. (b) The common regulators of clusters were analyzed using Pathway Studio 9.0, the significance threshold was set at p < 0.05. The percentage of HEC genes (“All”) or genes in clusters (C1–C5) regulated by various environmental stimuli or physiological regulators are depicted in heat maps. The color code depicts percentages.

