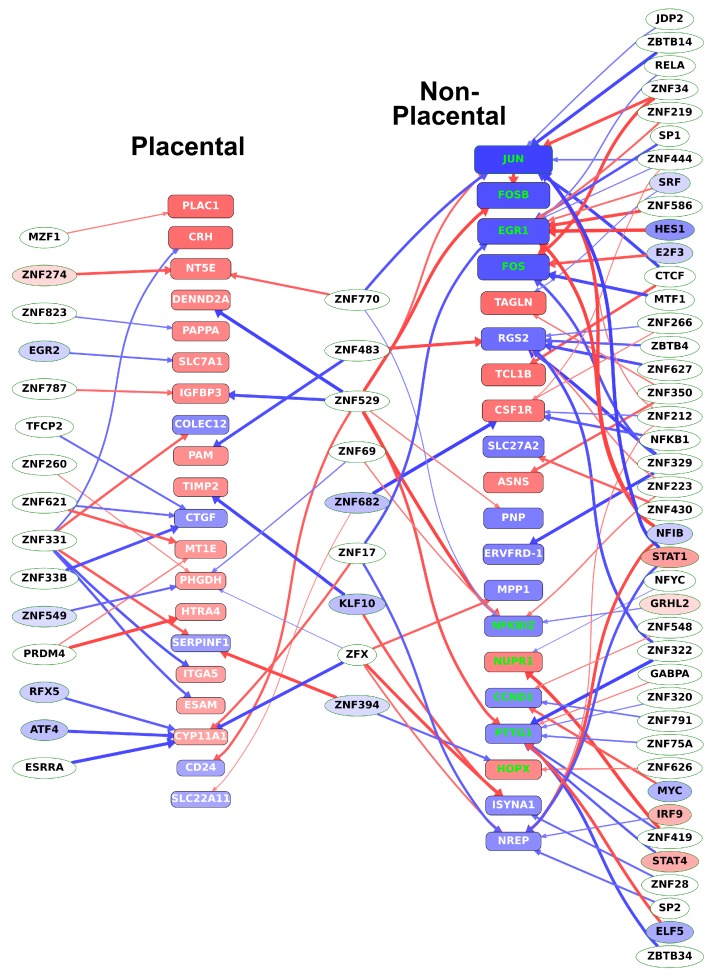
Figure 9.
Transcription factors regulating key target genes in villous trophoblast differentiation. The transcription factors regulating the top 20 (defined by absolute fold change) DE genes in both the placental and the non-placental module groups were determined from DNaseI footprinting data as described in Materials and methods. Target genes (placental and non-placental) are represented by rounded boxes. Box size represents absolute log2 fold change and the box color represents log2 fold change with a color scale from blue through red indicating negative through positive values. Target genes that are transcription regulatory (TR) genes are highlighted in green. Transcription factors are represented by ellipses, where differentially expressed TRs are colored by log2 fold change as above. Arrows indicate binding of the transcription factor to a promoter region of the target gene but are only shown if the absolute gene expression correlation coefficient between them is > 0.6. Thicker arrows indicate higher correlation. Arrow color indicates the sign of the correlation coefficient (blue: negative; red: positive). (Figure created with Tabnetviz (git.io/tabnetviz)).

