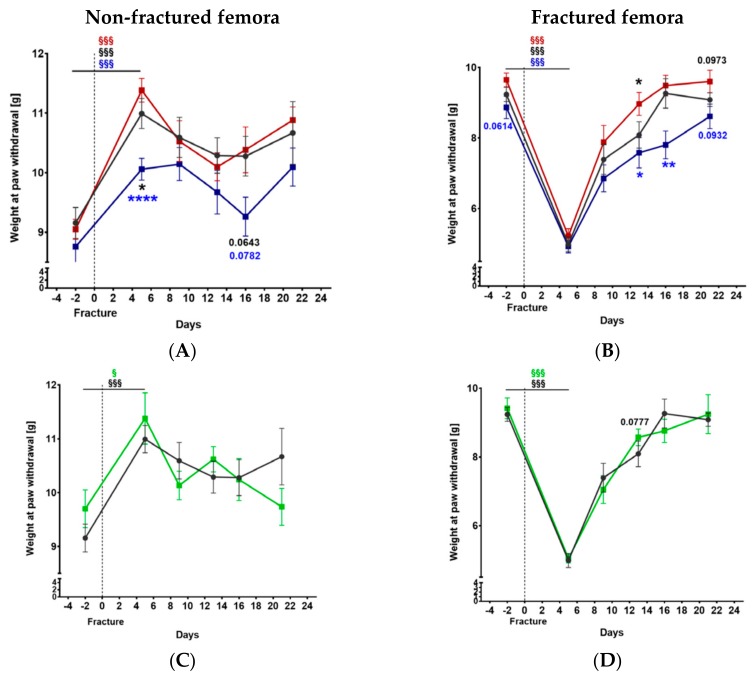
Figure 2.
The time course of mechanical hyperalgesia before and after fracture. The withdrawal threshold was measured using the Dynamic Plantar Aesthesiometer test for the non-fractured (A,B) and the fractured (C,D) femora of Tac1−/−, α-CGRP−/− (A,C), and SYX (B,D) mice in comparison to WT (black) mice. Data are expressed as mean ± SEM. §/§§§ indicates significance within the respective groups, demonstrated by the respective color. */p-values in black indicate differences between neurotransmitter deficient mice and WT animals. */**/****/p-Values in blue indicate differences between Tac1−/− and α-CGRP−/− mice. * = p ≤ 0.05; ** = p ≤ 0.01; **** = p ≤ 0.0001. N = 6–14.

