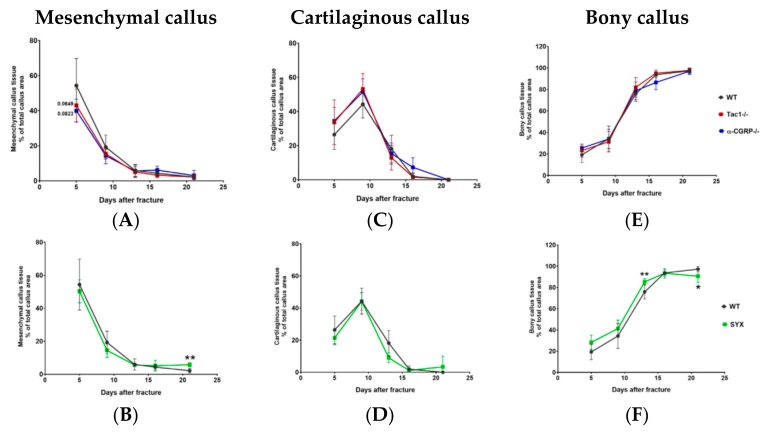
Figure 4.
Callus maturation during fracture healing. Area of mesenchymal (A,B), cartilaginous (C,D) and bony (E,F) callus tissue during fracture healing in Tac1−/−, α-CGRP−/− (A,C,E), SYX (B,D,F), and WT mice (A–F) at the time points 5, 9, 13, 16, and 21 days after fracture. Values were calculated as a percentage of total callus area and are presented as mean ± SD. */**/p-Values in black indicate differences between neurotransmitter deficient and SYX mice to WT. * = p ≤ 0.05; ** = p ≤ 0.01. N = 4–7.

